TRUMP SAYS: HUNTER MAKES FORTUNE FROM SHADY DEALS!
BIDEN FAMILY STINKS TO HIGH HEAVENS OF CORRUPTION!
DON'T GET LEFT OUT: HUNTER MUST BE STOPPED!

This report was originally published by Chris Martenson at PeakProsperity.com

Back in January of 2016 we saw what appeared to be, and in my opinion should have been, the end of the Everything Bubble blown by the word’s central banking cartel.
The carnage started in the emerging markets. Highly-leveraged positions and carry trades began to unwind. That’s a fancy way of saying that all the big, sophisticated investors — who were busy borrowing heavily in countries with cheap money (the US, Japan, and Europe) and using that debt to speculate in markets offering higher yields (junk debt, emerging markets, stocks, etc.) — began to reverse their trades.
It quickly devolved into a “Sell everything!” scramble. We saw the dollar spike and stocks fall — with emerging markets taking the full brunt of the carnage as their stock markets rapidly fell into bear territory, their currencies fell, and their bonds were destroyed.
Until…
Very early one morning in February of 2016 everything U-turned and rocketed higher. Suddenly and magically, the panic was over. This wasn’t the invisible hand of the market at work; it was the very-visible hand of central bank intervention.
With the benefit of hindsight, we now have a clear picture of what happened. The central banks huddled together, a bold (desperate?) plan was hatched, and key printing presses around the world were sent into overdrive. In the months to follow, the European Central Bank (ECB) and the Bank of Japan (BoJ) went on a record-breaking money printing spree:

(Source)
The red arrows in the charts above mark this moment when the “markets” were saved.
Or, more specifically, when the portfolios the ultra-wealthy were “saved”, as the assets within were boosted higher (yet again) by the central banks printing money from thin air:

(Source)
Addicted To Money Printing
So what caused the weakness in early 2016 that spooked the system so much? The central banks themselves.
After many years of force-feeding stimulus into the global economy to create a “recovery”, the central banks have become increasingly concerned that asset prices have become too dependent on said stimulus. So in late 2015, the banks took their feet off of their monetary gas pedals for a bit to see what might happen.
They were hoping that the markets could be gradually weaned off of their stimulus dependence with few ill effects. They wanted to engineer a “soft landing”, where if priced declined, they’d come down gradually and not too much.
That didn’t happen.
Instead, the cheap-money-addicted markets instantly started expressing massive withdrawal complications.
To re-acquaint you with how quickly things were devolving back then, these are news headlines pulled from an article I wrote back in the middle of January 2016:
Sound familiar at all? It should. These sound exactly like the headlines in the news today, here in May of 2018.
We are still paying the price from 2008, when the central banks committed a massive error by not allowing the markets and their bad debts to actually clear. Yes, it would have been acutely painful; but we would have been through the worst within a year or two and in the process restored the system to a much healthier and sustainable state.
Instead, the bad actors were protected (and rewarded!) and the root fundamental problems were literally ‘papered over’, left to continue to fester unobserved ever since. Similarly in early 2016, the central banks once again committed the same sin by rescuing everything with another wall of fresh, thin-air money.
To drive home how much, below is a chart showing the yearly change in world central bank balance sheets. The relative ‘area under the curve’ of each major period of money printing gives us a sense of the scale. To help you eyeball it, I’ve placed similar-sized orange rectangles in each area. Key to note is that central money printing has been increasing — not decreasing — the further out we’ve gotten from the Great Financial Crisis:

(Source)
If we’ve been in “recovery” for years now, as the central banks have been touting, then why has 2016-2108 seen the most stimulus ever injected into the system?
History has taught us that we should trust or leaders’ actions far more than their words. And their actions at this time indicate panic.
What is it that has them so worried? We should all ponder that question long and hard. I’m convinced that they know as well as we do that, once the over-inflated ““markets”” created by the central banks can no longer be sustained at their current nose-bleed heights, the damage will be extraordinary and unstoppable.
The End Of Stimulus? (And The Start Of The Crash?)
The pain of the 2008 crash will seem like a mere flesh wound compared to the devastation the next deflationary wave will wreak.
Of course, the central banks have no interest in seeing that happen and will, once more, do all they can to “rescue” the markets.
But will they act in time? More to the point, given all of their very public commitments to raising rates and reducing their balance sheets, will they allow a market correction to happen in the near term? (presumably, so they can ride to the rescue soon after as “saviors”)
Politically, the prospect of showering even more wealth on the 0.001% is going to be a tough sell. This is especially true in Europe — in Italy, Greece and Spain where the populace is suffering mightily already and is in no mood to further enrich the ultra-wealthy.
So it would seem that the central banks, at least publicly, have to stick to their stated plans to reduce their levels of money printing/balance sheet expansion.
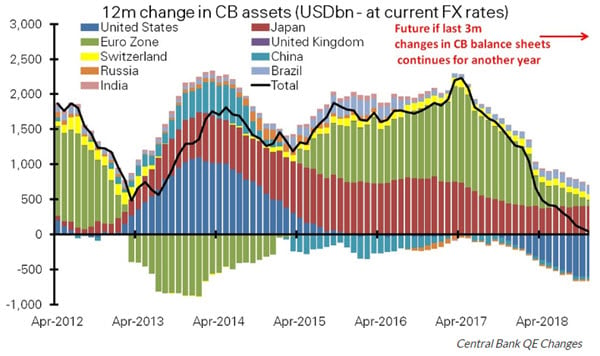
As of right now, they are on track to end worldwide stimulus in early 2019, when their collective net change in assets will dip below $0 for the first time in many years:

(Source)
Given the importance of central bank purchases and market interventions, the above chart is probably the most important one in existence for divining where financial asset prices are headed.
If global monthly stimulus indeed drops to $0, then Watch out below!
Who know if the future will plays out anything like the projections given above? The central banks have proven weak-kneed at every tiny moment of market wobbliness. To date, they’ve chosen to print and pent and then print some more at every opportunity where the ““markets”” might have corrected.
But we all know that this charade cannot continue forever. Sooner or later it has to stop. Given the blow-ups we’re now seeing in the emerging markets, there’s clearly serious trouble brewing somewhere in the system.
In Part 2: The Breaking Point Is Upon Us we provide plenty of data to support that claim.
The currencies and bonds of five countries are now in the danger zone, and many more teeter on the edge. My analysis is that the central banks will resort to their usual money printing to resolve the issue, but for reasons I explain in Part 2, these efforts will fail at some point in the next year — and spectacularly so.
When today’s Everything Bubble bursts, the effect will be nothing short of catastrophic as 50 years of excessive debt accumulation suddenly deflates.
Given the dangers involved, you should expect the central banks to ‘go nuclear’ in their deflation-fighting efforts by sending “money to main street” — likely in the form of a universal basic income, or a check from the Treasury refunding your last 3 years of tax payments, or maybe even an electronic deposit directly from the Federal Reserve into your bank account.
That’s when the inevitable fiat currency crisis will begin in earnest. At that time you’ll need to run, not walk, to buy anything with intrinsic value that can’t be inflated away — before your currency becomes worthless.
Click here to read Part 2 of this report (free executive summary, enrollment required for full access)

It Took 22 Years to Get to This Point
Two domestic cats have died after drinking raw milk recalled for bird flu risk in California. A...
This article was originally published by Rhoda Wilson at The Exposé. We have all become familiar...
Conservative political commentator Tucker Carlson took part in a wide-ranging interview that was...
Commenting Policy:
Some comments on this web site are automatically moderated through our Spam protection systems. Please be patient if your comment isn’t immediately available. We’re not trying to censor you, the system just wants to make sure you’re not a robot posting random spam.
This website thrives because of its community. While we support lively debates and understand that people get excited, frustrated or angry at times, we ask that the conversation remain civil. Racism, to include any religious affiliation, will not be tolerated on this site, including the disparagement of people in the comments section.


Trump Alludes to Stock Market Bubble
https://www.youtube.com/watch?v=M0zg_Cf4K4w
High gas prices are always a prerequisite to a crash. When we see $3.50 a gallon (currently 2.80 a gallon in my area) then I think collapse will be closely following.
$3.79 per gallon here and everyone is still driving.
Thankfully I now longer commute, but lots of people still drive over a hundred miles a day back and forth to get to work at jobs paying $14 an hour or less.
The corollary to “No news is good news” is “All news is bad news”. Now the news is going from bad to worse. Good luck everyone.
If the feds dump an ass load of money in my bank account or by check in order to correct deflation I will immediately assist them in their attemp to do so and purchase as much ammo,guns,cigarettes and hard liquor (rum cus im a bit of a pirate and no not the butt pirate type lol) as they afford me to..and some more can goods too
Those of you who wish to go buy silver and gold with yours go ahead ill gladly trade you a pack of Marlboro reds for an oz of gold in 6 months. No serious im not tradeing my smokes but will sell ya a shot of pirate rum for a silver dabloom. Arrrr mate. And like all pirates then shoot ya with my gov funded/provided ammo and rob ya of your booty (no not your butt booty haha).
Why is it that the price of a gallon of gas is always the same as a gallon of milk? I noticed this years ago cus a pack of smokes was also the same too but because they criminalized cigarettes the taxes on them made them double that of a gal gas or milk???
Around here, gas is usually cheaper than milk, which is puzzling considering all the costs to get gas to my car compared to the lesser costs of getting milk from a local farm to my refrigerator.
Right now, gas is a little higher than milk. Milk is now around $2.50, when it used to be over $3.00. Bread is also a little cheaper than it was a few years ago. So by buying when things are on sale, I’m not spending any more on groceries than I was 10 years ago.
WARNING! Do not go to a fema camp there will be butt pirates there….
Not sure what I just read but ready or not, Here it comes! ??????